

The latest view of the stock market for investors is: (the tint in the background is very helpful)
You can get more details here: Wall Street Genius Market explanation
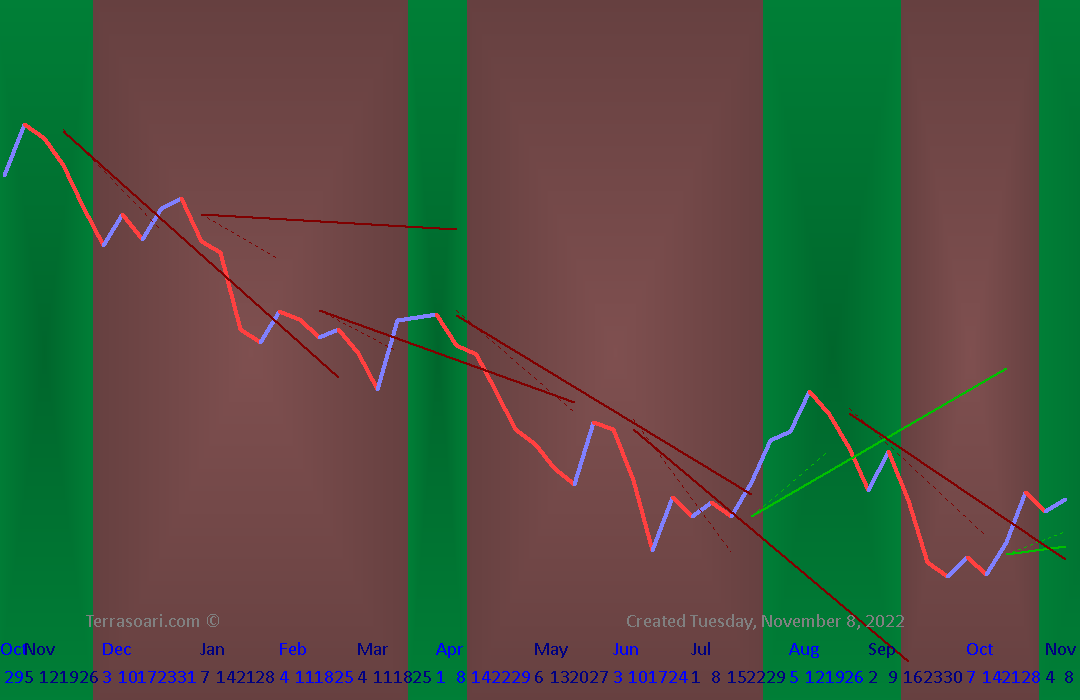
The LONG term monthly chart gives the best perspective for longer term investors. This chart shows the biggest, best picture of timing. For example, waiting for the Red to end is usually better than jumping in on the first green signs on the Weekly chart above. Avoid small, partial recoveries in a falling market. Avoid generally flat and Bear markets by using this long term (multi-year) chart. For Long Term investors, this is the chart for you.